I built a concurrent worker pool in Go - a fixed set of goroutines pulling jobs off a channel, executing HTTP fetches, and reporting results. I want to see what it is doing: how many jobs succeeded, how long they took, what the logs said, where time was spent (including internals and GC, of course!).
This post walks through adding the full LGTM stack (plus continuous profiling) to that pool:
- Loki: log storage
- Grafana: visualization (docs)
- Tempo: trace storage
- Metrics via Prometheus
- Pyroscope: continuous profiling and flame graphs
Every import, every config line, and every design decision is explained.
The Architecture
app (Go, runs natively)
 ├── :8080/metrics    ←── Prometheus scrapes every 5s
 ├── logs/app.log     ←── Promtail tails and ships to Loki
 ├── OTLP gRPC :4317 ←── Tempo receives traces
 └── push :4040      ←── Pyroscope receives profiles

Prometheus ──┐
Loki        ──┤
Tempo       ──┤──► Grafana :3000
Pyroscope   ──┘
The app runs natively on your machine. The entire observability stack runs in Docker Compose.
Metrics with Prometheus
What Prometheus does
Prometheus is a pull-based metrics system. Your app exposes a /metrics HTTP endpoint serving plain text in the Prometheus exposition format. Prometheus scrapes that endpoint on an interval, stores the time-series data, and makes it queryable with PromQL.
See the Prometheus Getting Started guide for a full introduction.
Defining metrics
All metric definitions live in their own metrics/ package to keep main.go focused on orchestration:
package metrics

import "github.com/prometheus/client_golang/prometheus"

type Metrics struct {
    JobsTotal     *prometheus.CounterVec
    JobDuration   prometheus.Histogram
    WorkersActive prometheus.Gauge
}

func NewMetrics(reg prometheus.Registerer) *Metrics {
    m := &Metrics{
        JobsTotal: prometheus.NewCounterVec(
            prometheus.CounterOpts{
                Name: "jobs_total",
                Help: "Total number of jobs processed, by status.",
            },
            []string{"status"},
        ),
        JobDuration: prometheus.NewHistogram(prometheus.HistogramOpts{
            Name:    "job_duration_seconds",
            Help:    "Time spent executing a job.",
            Buckets: []float64{0.1, 0.25, 0.5, 1, 2.5, 5},
        }),
        WorkersActive: prometheus.NewGauge(prometheus.GaugeOpts{
            Name: "workers_active",
            Help: "Number of workers currently executing a job.",
        }),
    }
    reg.MustRegister(m.JobsTotal)
    reg.MustRegister(m.JobDuration)
    reg.MustRegister(m.WorkersActive)
    return m
}
Why these three types:
CounterVec: a counter with labels.jobs_total{status="success"}andjobs_total{status="failed"}are two separate time series from one definition. Counters only go up, which makes them safe withrate()in PromQL. Never use a gauge for something that only increases.Histogram: records observations in configurable buckets. TheBucketsslice defines upper bounds in seconds. Prometheus automatically derives_bucket,_sum, and_countseries, which enables percentile queries likehistogram_quantile(0.95, ...).Gauge: a value that goes up and down. Correct for “how many workers are busy right now.”
Why a custom registry instead of the default global one: The default Prometheus registry auto-includes Go runtime metrics (GC pause times, goroutine counts, heap stats). A custom registry gives you control over exactly what gets exposed, useful when you want a clean output with only your own metrics.
Exposing the /metrics endpoint
import (
    "github.com/prometheus/client_golang/prometheus"          // Registry, metric types, GaugeFunc
    "github.com/prometheus/client_golang/prometheus/promhttp" // HTTP handler for /metrics
)

reg := prometheus.NewRegistry()
m := metrics.NewMetrics(reg)

mux := http.NewServeMux()
mux.Handle("/metrics", promhttp.HandlerFor(reg, promhttp.HandlerOpts{Registry: reg}))
promhttp.HandlerFor takes a specific registry rather than the global one, which is required when using a custom registry. promhttp.HandlerOpts{Registry: reg} tells the handler to register its own internal metrics (like how many times /metrics was scraped) in the same registry.
The server starts in a goroutine so the worker pool runs concurrently:
srv := &http.Server{Addr: ":8080", Handler: mux}
go func() {
    if err := srv.ListenAndServe(); err != nil && err != http.ErrServerClosed {
        slog.Error("server listen failed", "err", err)
        os.Exit(1)
    }
}()
Queue depth with GaugeFunc
The jobs channel buffer is a live value, not an event that happens at a point in time. GaugeFunc calls len(jobs) on every Prometheus scrape instead of requiring manual tracking:
reg.MustRegister(prometheus.NewGaugeFunc(prometheus.GaugeOpts{
    Name: "jobs_queue_depth",
    Help: "Number of jobs currently waiting in the queue.",
}, func() float64 { return float64(len(jobs)) }))
The closure captures the jobs channel. The value is always current.
Recording metrics in the worker
m.WorkersActive.Inc()
start := time.Now()
r := task.Run(jobCtx, &j)
m.JobDuration.Observe(time.Since(start).Seconds())
m.WorkersActive.Dec()
if r.Err != nil {
    m.JobsTotal.WithLabelValues("failed").Inc()
} else {
    m.JobsTotal.WithLabelValues("success").Inc()
}
WorkersActive brackets the execution. Observe records elapsed seconds into the histogram. WithLabelValues("failed") sets the status label on the counter for that specific time series.
Prometheus scrape config
prometheus.yml tells Prometheus where to find the app:
global:
  scrape_interval: 5s

scrape_configs:
  - job_name: "go-worker-pool"
    static_configs:
      - targets: ["host.docker.internal:8080"]
host.docker.internal is Docker’s built-in DNS name for the Mac host. Because the app runs natively (not in Docker), this is how the Prometheus container reaches port 8080 on your machine.
Useful PromQL queries
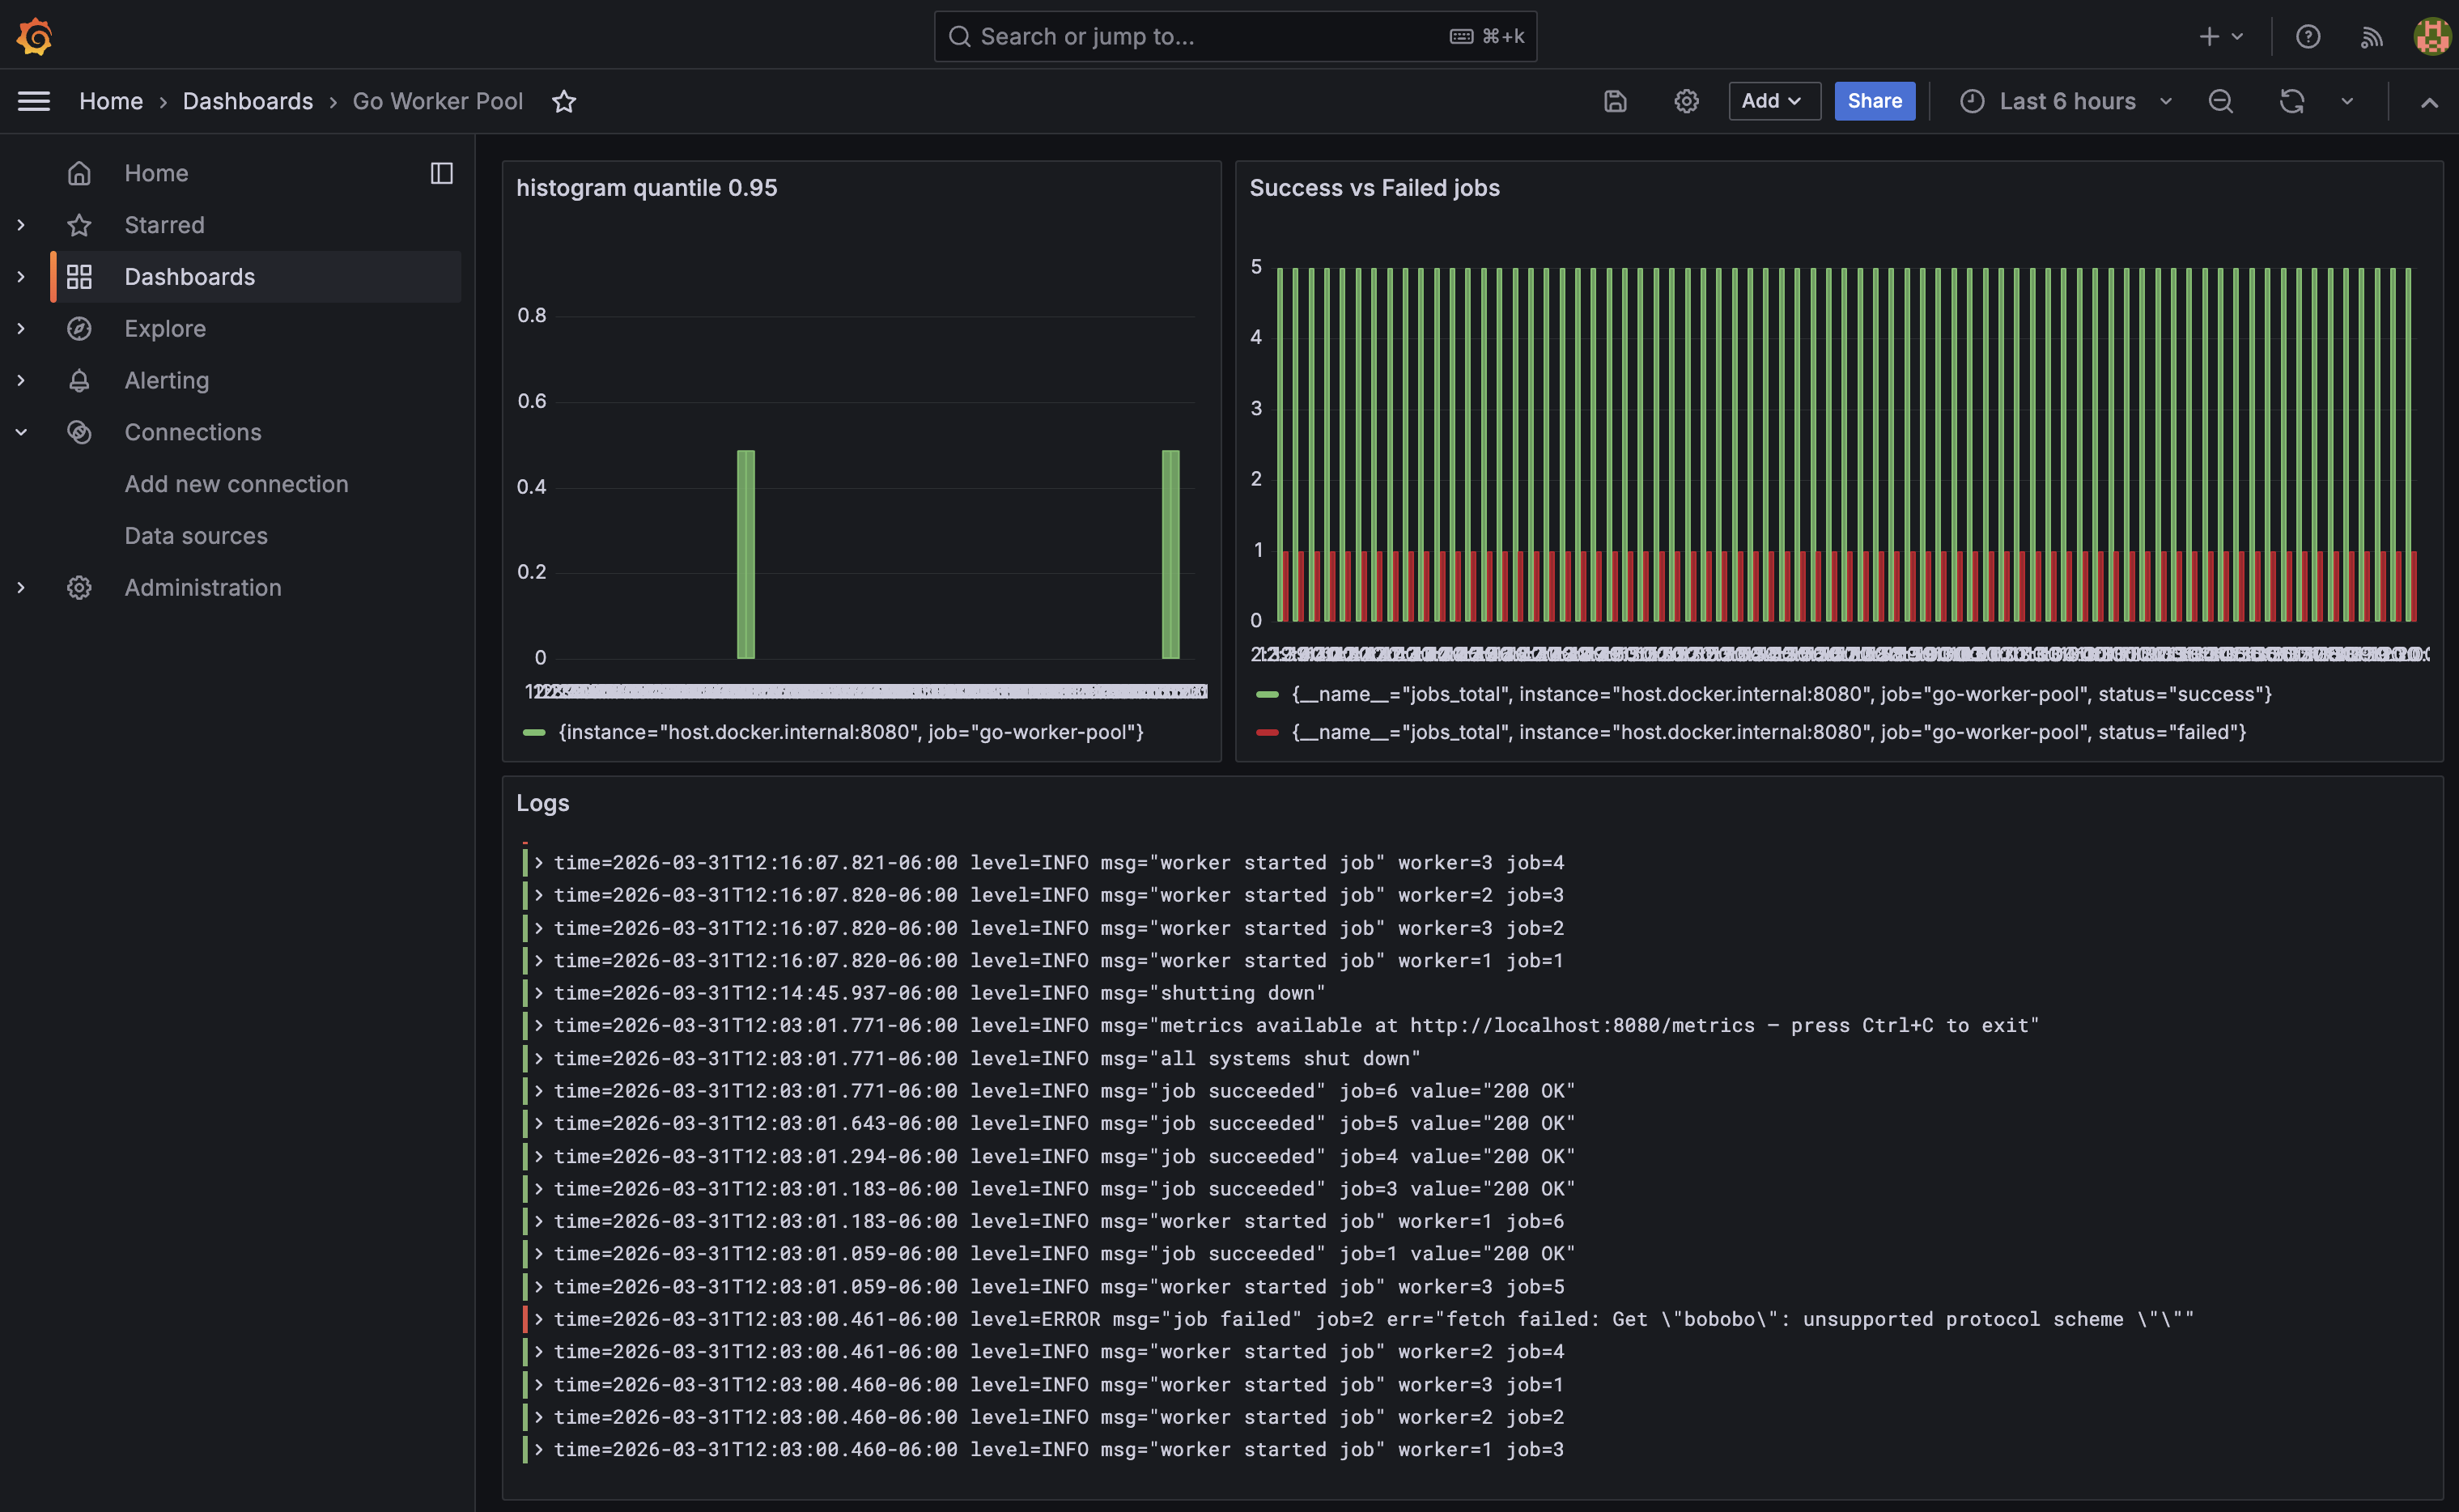
Once Prometheus is scraping, use these in Grafana:
jobs_total: raw totals by status (use this when the pool has already finished)rate(jobs_total{status="success"}[1m]): jobs per second succeedingworkers_active: how many workers are currently busyjobs_queue_depth: backlog of unprocessed jobshistogram_quantile(0.95, rate(job_duration_seconds_bucket[1m])): 95th percentile job duration
Go runtime metrics
The custom registry also includes Go runtime and process collectors:
reg.MustRegister(prometheus.NewGoCollector())
reg.MustRegister(prometheus.NewProcessCollector(prometheus.ProcessCollectorOpts{}))
NewGoCollector exposes Go runtime internals. NewProcessCollector exposes OS-level process stats. These are excluded from the custom registry by default (they come free with the global default registry), so they must be registered explicitly.
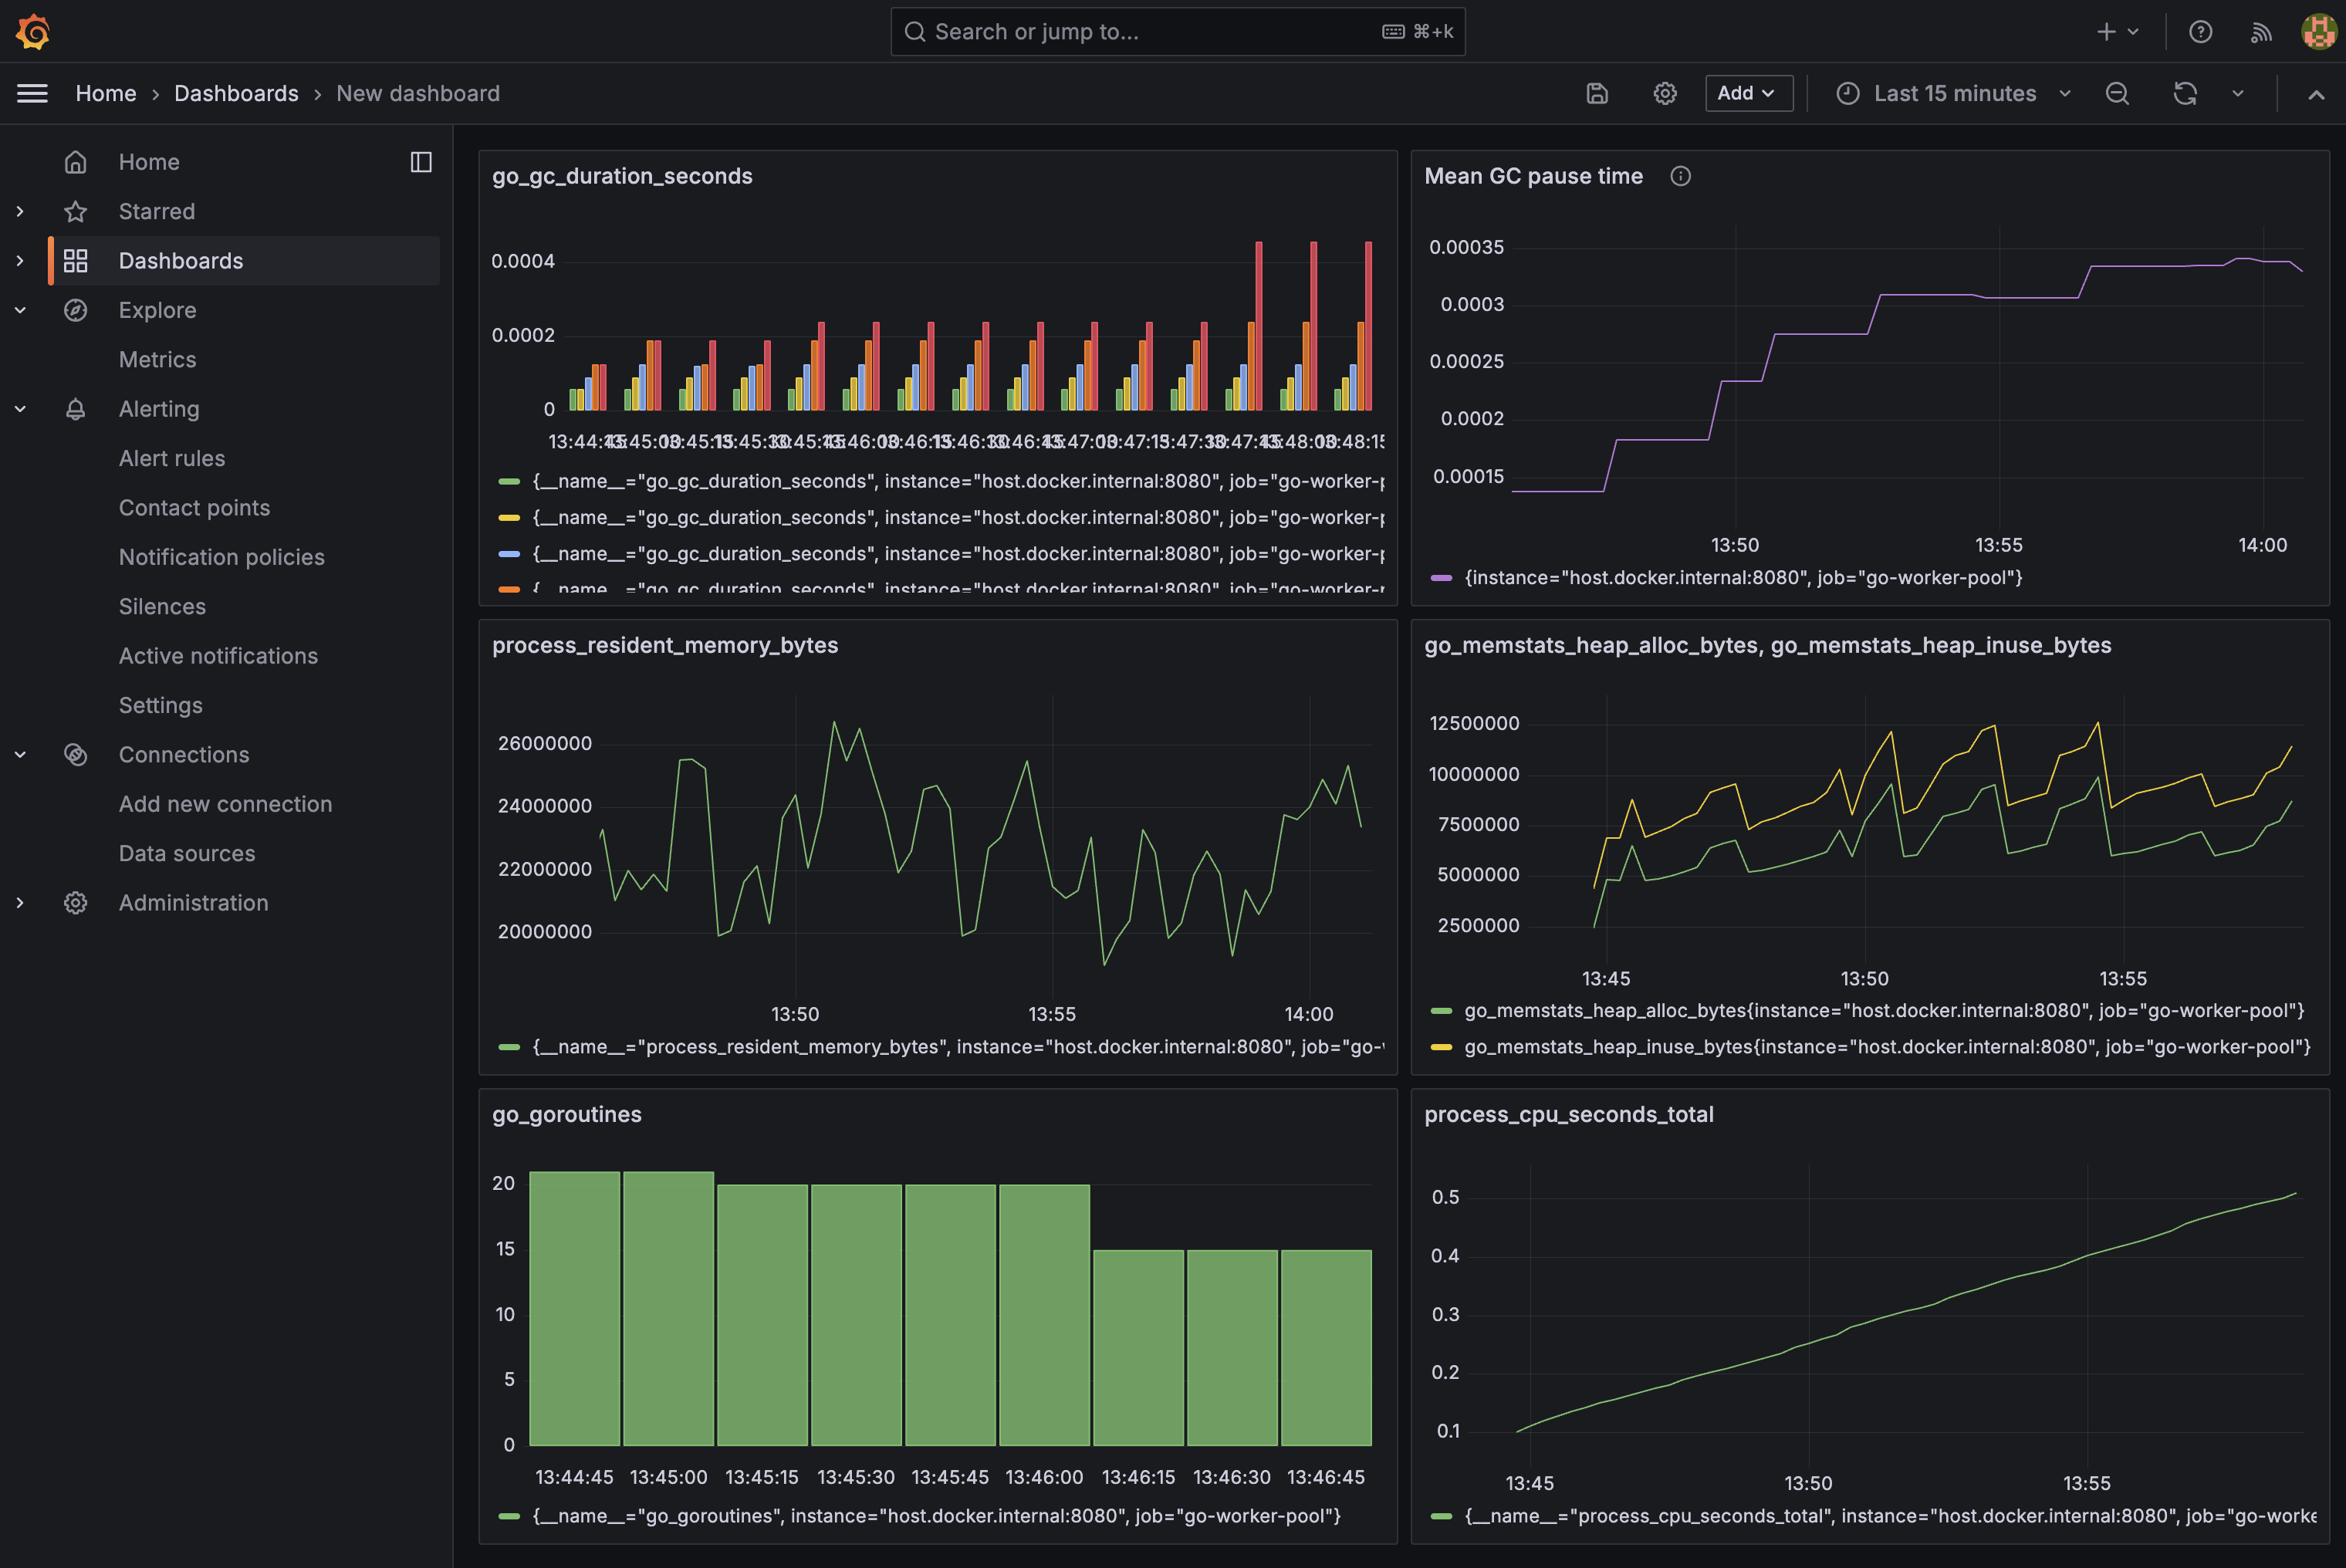
This gives you a second set of PromQL queries:
go_goroutines: current goroutine count, useful for detecting leaksgo_gc_duration_seconds{quantile="1"}: worst GC pause seen (go_gc_duration_secondsis a summary with fixed quantiles:0,0.25,0.5,0.75,1- there is no p99)go_memstats_heap_inuse_bytes: heap memory actively in useprocess_cpu_seconds_total: cumulative CPU time (userate()for per-second)process_resident_memory_bytes: RSS, total memory held by the process
These are the Prometheus equivalent of what go tool trace and runtime/pprof show, but available continuously in Grafana rather than requiring a manual capture. For a deeper look at what each of these metrics actually measures and its quirks, see Go Runtime Metrics in Prometheus: What They Mean and When to Trust Them.
Logs with Loki and Promtail
What Loki does
Loki is a log aggregation system built by Grafana Labs. Unlike Elasticsearch, it does not full-text index log content. It only indexes labels (like job="go-worker-pool"), which makes it dramatically cheaper to run. Log content is queried with regular expressions via LogQL.
What Promtail does
Promtail is a log shipping agent. It tails files on disk and pushes new lines to Loki. It is to logs what Prometheus is to metrics, except Promtail pushes while Prometheus pulls.
Writing to a file with slog
Go’s standard log/slog package (added in Go 1.21) supports structured logging with key-value pairs. Configuring it to write to both stderr and a file uses io.MultiWriter:
import (
    "io"       // io.MultiWriter — fans writes out to multiple destinations simultaneously
    "log/slog" // structured logging standard library
)

logFile, err := os.OpenFile("logs/app.log",
    os.O_CREATE|os.O_APPEND|os.O_WRONLY, // create if missing, always append, write-only
    0644,
)

logger := slog.New(slog.NewTextHandler(
    io.MultiWriter(os.Stderr, logFile), // write to both at once
    &slog.HandlerOptions{Level: slog.LevelInfo},
))
slog.SetDefault(logger) // all slog.Info/Error calls use this handler
O_APPEND is important for log files. It guarantees writes always go to the end of the file, safe even if multiple processes write to it.
Promtail config
server:
  http_listen_port: 9080 # Promtail's own metrics port
  grpc_listen_port: 0    # disabled

positions:
  filename: /tmp/positions.yaml
  # Tracks how far into each file Promtail has read.
  # On restart, it resumes from here instead of re-sending old logs.

clients:
  - url: http://loki:3100/loki/api/v1/push # Loki's ingest HTTP endpoint

scrape_configs:
  - job_name: go-worker-pool
    static_configs:
      - targets:
          - localhost
        labels:
          job: go-worker-pool     # label attached to every log line shipped to Loki
          __path__: /logs/app.log # file to tail (path inside the container via volume mount)
The __path__ label is special. Promtail uses it to determine which file to watch and does not send it to Loki. All other labels (job) are attached to every log line, making them filterable in LogQL.
Traces with OpenTelemetry and Tempo
What distributed tracing is
A trace represents a unit of work as it flows through your system. Each step is a span. Spans form a tree. A parent span can have child spans. For the worker pool, each job execution is one span with attributes describing which worker ran it and what URL it fetched.
What OpenTelemetry is
OpenTelemetry is a vendor-neutral standard and SDK for producing traces, metrics, and logs. Using it means your instrumentation is not tied to any backend. You can switch from Tempo to Jaeger or Honeycomb by changing one exporter line. The OTel SDK separates the API (what your code calls) from the SDK (the implementation and exporter).
What Tempo does
Tempo is Grafana’s trace storage backend. It receives spans over the OTLP protocol, stores them efficiently, and serves them to Grafana. It uses the same label-based indexing philosophy as Loki, making it cheap to run.
Installing the packages
go get go.opentelemetry.io/otel \
       go.opentelemetry.io/otel/sdk/trace \
       go.opentelemetry.io/otel/exporters/otlp/otlptrace/otlptracegrpc \
       go.opentelemetry.io/otel/sdk/resource \
       go.opentelemetry.io/otel/semconv/v1.26.0 \
       go.opentelemetry.io/otel/attribute \
       go.opentelemetry.io/otel/codes
What each import does
import (
    "go.opentelemetry.io/otel"
    // The OTel API — global tracer access via otel.Tracer().
    // Your application code only imports this, keeping it decoupled from the SDK.

    "go.opentelemetry.io/otel/attribute"
    // Typed key-value pairs for span attributes: attribute.Int(), attribute.String(), etc.

    "go.opentelemetry.io/otel/codes"
    // Span status constants: codes.Ok and codes.Error.
    // Distinct from HTTP status codes — this is OTel's own pass/fail signal.

    "go.opentelemetry.io/otel/exporters/otlp/otlptrace/otlptracegrpc"
    // The gRPC exporter. Serializes completed spans and ships them to Tempo on port 4317.

    "go.opentelemetry.io/otel/sdk/resource"
    // Service metadata attached to every span: name, version, environment.

    sdktrace "go.opentelemetry.io/otel/sdk/trace"
    // The SDK implementation: TracerProvider, batching, sampling, exporters.
    // Aliased as sdktrace to distinguish from the API's trace package.

    semconv "go.opentelemetry.io/otel/semconv/v1.26.0"
    // Standardized attribute key names defined by the OTel spec.
    // semconv.ServiceName() produces the correct "service.name" key.
)
Initializing the tracer provider
func initTracer(ctx context.Context) (*sdktrace.TracerProvider, error) {
    // The exporter connects to Tempo and serializes spans for transport.
    exp, err := otlptracegrpc.New(ctx,
        otlptracegrpc.WithEndpoint("localhost:4317"), // Tempo's OTLP gRPC port
        otlptracegrpc.WithInsecure(),                 // no TLS — local dev only
    )
    if err != nil {
        return nil, err
    }

    tp := sdktrace.NewTracerProvider(
        // WithBatcher batches spans before exporting (more efficient than one-by-one).
        sdktrace.WithBatcher(exp),
        // WithResource attaches service metadata to every span this provider creates.
        sdktrace.WithResource(resource.NewWithAttributes(
            semconv.SchemaURL,
            semconv.ServiceName("go-worker-pool"), // this is what appears in Grafana
        )),
    )

    // Register as the global provider so otel.Tracer() works anywhere in the app.
    otel.SetTracerProvider(tp)
    return tp, nil
}
In main, initialize early and always call Shutdown on exit, which flushes any buffered spans that haven’t been exported yet:
tp, err := initTracer(context.Background())
if err != nil {
    slog.Error("failed to initialize tracer", "err", err)
    os.Exit(1)
}
defer tp.Shutdown(context.Background())
Instrumenting the worker
// Get a tracer scoped to this component. The name appears in the span's library field.
tracer := otel.Tracer("worker")

// Start a span. jobCtx carries the span — pass it to downstream calls
// so any spans they create become children of this one.
jobCtx, span := tracer.Start(ctx, "process_job")

// Attributes are searchable in Grafana's trace explorer.
span.SetAttributes(
    attribute.Int("worker.id", id),
    attribute.Int("job.id", j.ID),
    attribute.String("job.url", j.URL),
)

r := task.Run(jobCtx, &j) // jobCtx passed so child spans attach here

if r.Err != nil {
    span.SetStatus(codes.Error, r.Err.Error()) // marks span red in Grafana
} else {
    span.SetStatus(codes.Ok, "")
}

span.End() // REQUIRED — without this the span is never exported
span.End() is critical. The span is not sent to the exporter until End() is called. A forgotten End() means silent data loss.
Tempo config
server:
  http_listen_port: 3200  # Grafana queries Tempo on this port

distributor:
  receivers:
    otlp:
      protocols:
        grpc:
          endpoint: 0.0.0.0:4317  # receives spans from the app's OTLP exporter

storage:
  trace:
    backend: local
    local:
      path: /tmp/tempo/traces  # trace data stored inside the container
    wal:
      path: /tmp/tempo/wal     # write-ahead log for durability on crash
The Docker Compose Stack
services:
  prometheus:
    image: prom/prometheus:latest
    ports:
      - "9090:9090"
    volumes:
      # Replace default config with our scrape config
      - ./prometheus.yml:/etc/prometheus/prometheus.yml

  loki:
    image: grafana/loki:latest
    ports:
      - "3100:3100"

  promtail:
    image: grafana/promtail:latest
    volumes:
      - ./promtail-config.yml:/etc/promtail/config.yml
      # Mount the app's log directory into the container so Promtail can tail it
      - ./logs:/logs
    command: -config.file=/etc/promtail/config.yml
    depends_on:
      - loki

  tempo:
    image: grafana/tempo:2.6.1  # pinned — see note below
    command: -config.file=/etc/tempo.yml
    ports:
      - "3200:3200"  # Grafana queries here
      - "4317:4317"  # app sends spans here
    volumes:
      - ./tempo.yml:/etc/tempo.yml

  grafana:
    image: grafana/grafana:latest
    ports:
      - "3000:3000"
    environment:
      - GF_SECURITY_ADMIN_PASSWORD=admin
    depends_on:
      - prometheus
      - loki
      - tempo
The ./logs:/logs volume is the key connection between the native app and Promtail inside Docker. The app writes to ./logs/app.log on your Mac, and the container sees it at /logs/app.log.
Note on pinned versions: Tempo
latest(v2.10+) introduced a Kafka-based ingest pipeline that requires additional configuration not covered here, so pin to2.6.1to avoid it. Grafana is pinned to11.2.0for compatibility with Tempo 2.6.1. Newer Grafana versions have a rendering bug with Tempo trace data that throws a circular JSON error. Grafana dashboards and data sources persist across restarts via thegrafana-storagenamed volume. To wipe them intentionally, rundocker compose down -v.
Running the Full Stack
mkdir -p logs       # create the log directory (it's gitignored)
make run            # terminal 1 — starts the app
docker compose up   # terminal 2 — starts the observability stack
Add data sources in Grafana
Open http://localhost:3000 (login: admin / admin), go to Connections → Data sources → Add, and add each:
- Prometheus:
http://prometheus:9090 - Loki:
http://loki:3100 - Tempo:
http://tempo:3200
Use the container service names, not localhost. Inside Docker, localhost refers to the container itself. prometheus, loki, and tempo are resolved by Docker’s internal DNS.
Querying in Explore
Metrics (Prometheus):
jobs_total
histogram_quantile(0.95, rate(job_duration_seconds_bucket[1m]))
Logs (Loki):
{job="go-worker-pool"}
{job="go-worker-pool"} |= "failed"
Traces (Tempo): Search by service name go-worker-pool. Each job shows as a process_job span with worker.id, job.id, and job.url attributes. Failed jobs are marked with error status and show the error message.
Profiles (Pyroscope): Select service go-worker-pool and a profile type. CPU shows which functions consume the most time. Heap and alloc profiles show where memory is being allocated.
Continuous Profiling with Pyroscope
What Pyroscope does
Pyroscope is Grafana’s continuous profiling backend. Traditional profiling with go tool pprof and go tool trace requires a manual capture - you run the tool, collect data, then analyze it offline. Pyroscope samples your app’s pprof data continuously and stores it, so you can look at flame graphs for any time window in the past.
Installing the SDK
go get github.com/grafana/pyroscope-goThe import
pyroscope "github.com/grafana/pyroscope-go"
// Starts a background goroutine that samples pprof data and pushes it to Pyroscope.
Starting the profiler
profiler, err := pyroscope.Start(pyroscope.Config{
    ApplicationName: "go-worker-pool",       // appears as the service name in Grafana
    ServerAddress:   "http://localhost:4040", // Pyroscope's ingest endpoint
    ProfileTypes: []pyroscope.ProfileType{
        pyroscope.ProfileCPU,           // where CPU time is spent (flame graph)
        pyroscope.ProfileAllocObjects,  // number of objects allocated (even if freed)
        pyroscope.ProfileAllocSpace,    // bytes allocated (even if freed)
        pyroscope.ProfileInuseObjects,  // objects currently live on the heap
        pyroscope.ProfileInuseSpace,    // bytes currently live on the heap
    },
})
if err != nil {
    slog.Error("failed to start profiler", "err", err)
    os.Exit(1)
}
defer profiler.Stop() // flushes any pending profiles on shutdown
Profile types explained:
- CPU - sampled every 10ms, shows which functions are on the call stack most often. This is the flame graph. Wide bars = hot code paths.
- AllocObjects / AllocSpace - cumulative allocations since start. Useful for finding code that creates excessive garbage, even if GC collects it promptly.
- InuseObjects / InuseSpace - live heap at the moment of sampling. Useful for tracking down memory leaks. If a function keeps growing in inuse profiles, it’s holding references.
Adding Pyroscope to docker-compose
pyroscope:
  image: grafana/pyroscope:latest
  ports:
    - "4040:4040"  # ingest and UI
No config file needed. Pyroscope works out of the box with its defaults.
Adding the data source in Grafana
- Go to Connections → Data sources → Add → select Grafana Pyroscope
- Set URL to
http://pyroscope:4040 - Click Save & test
- Go to Explore → Pyroscope, select service
go-worker-pool
Reading a flame graph
The flame graph shows the call stack bottom-up. The bottom row is the entry point (main), each row above it is a function called by the one below. Width represents time (CPU) or bytes (memory). Click any bar to zoom in on that subtree.
For the worker pool, the CPU flame graph will be dominated by the HTTP client internals since all the work is network I/O, which confirms the pool is I/O-bound, not CPU-bound.
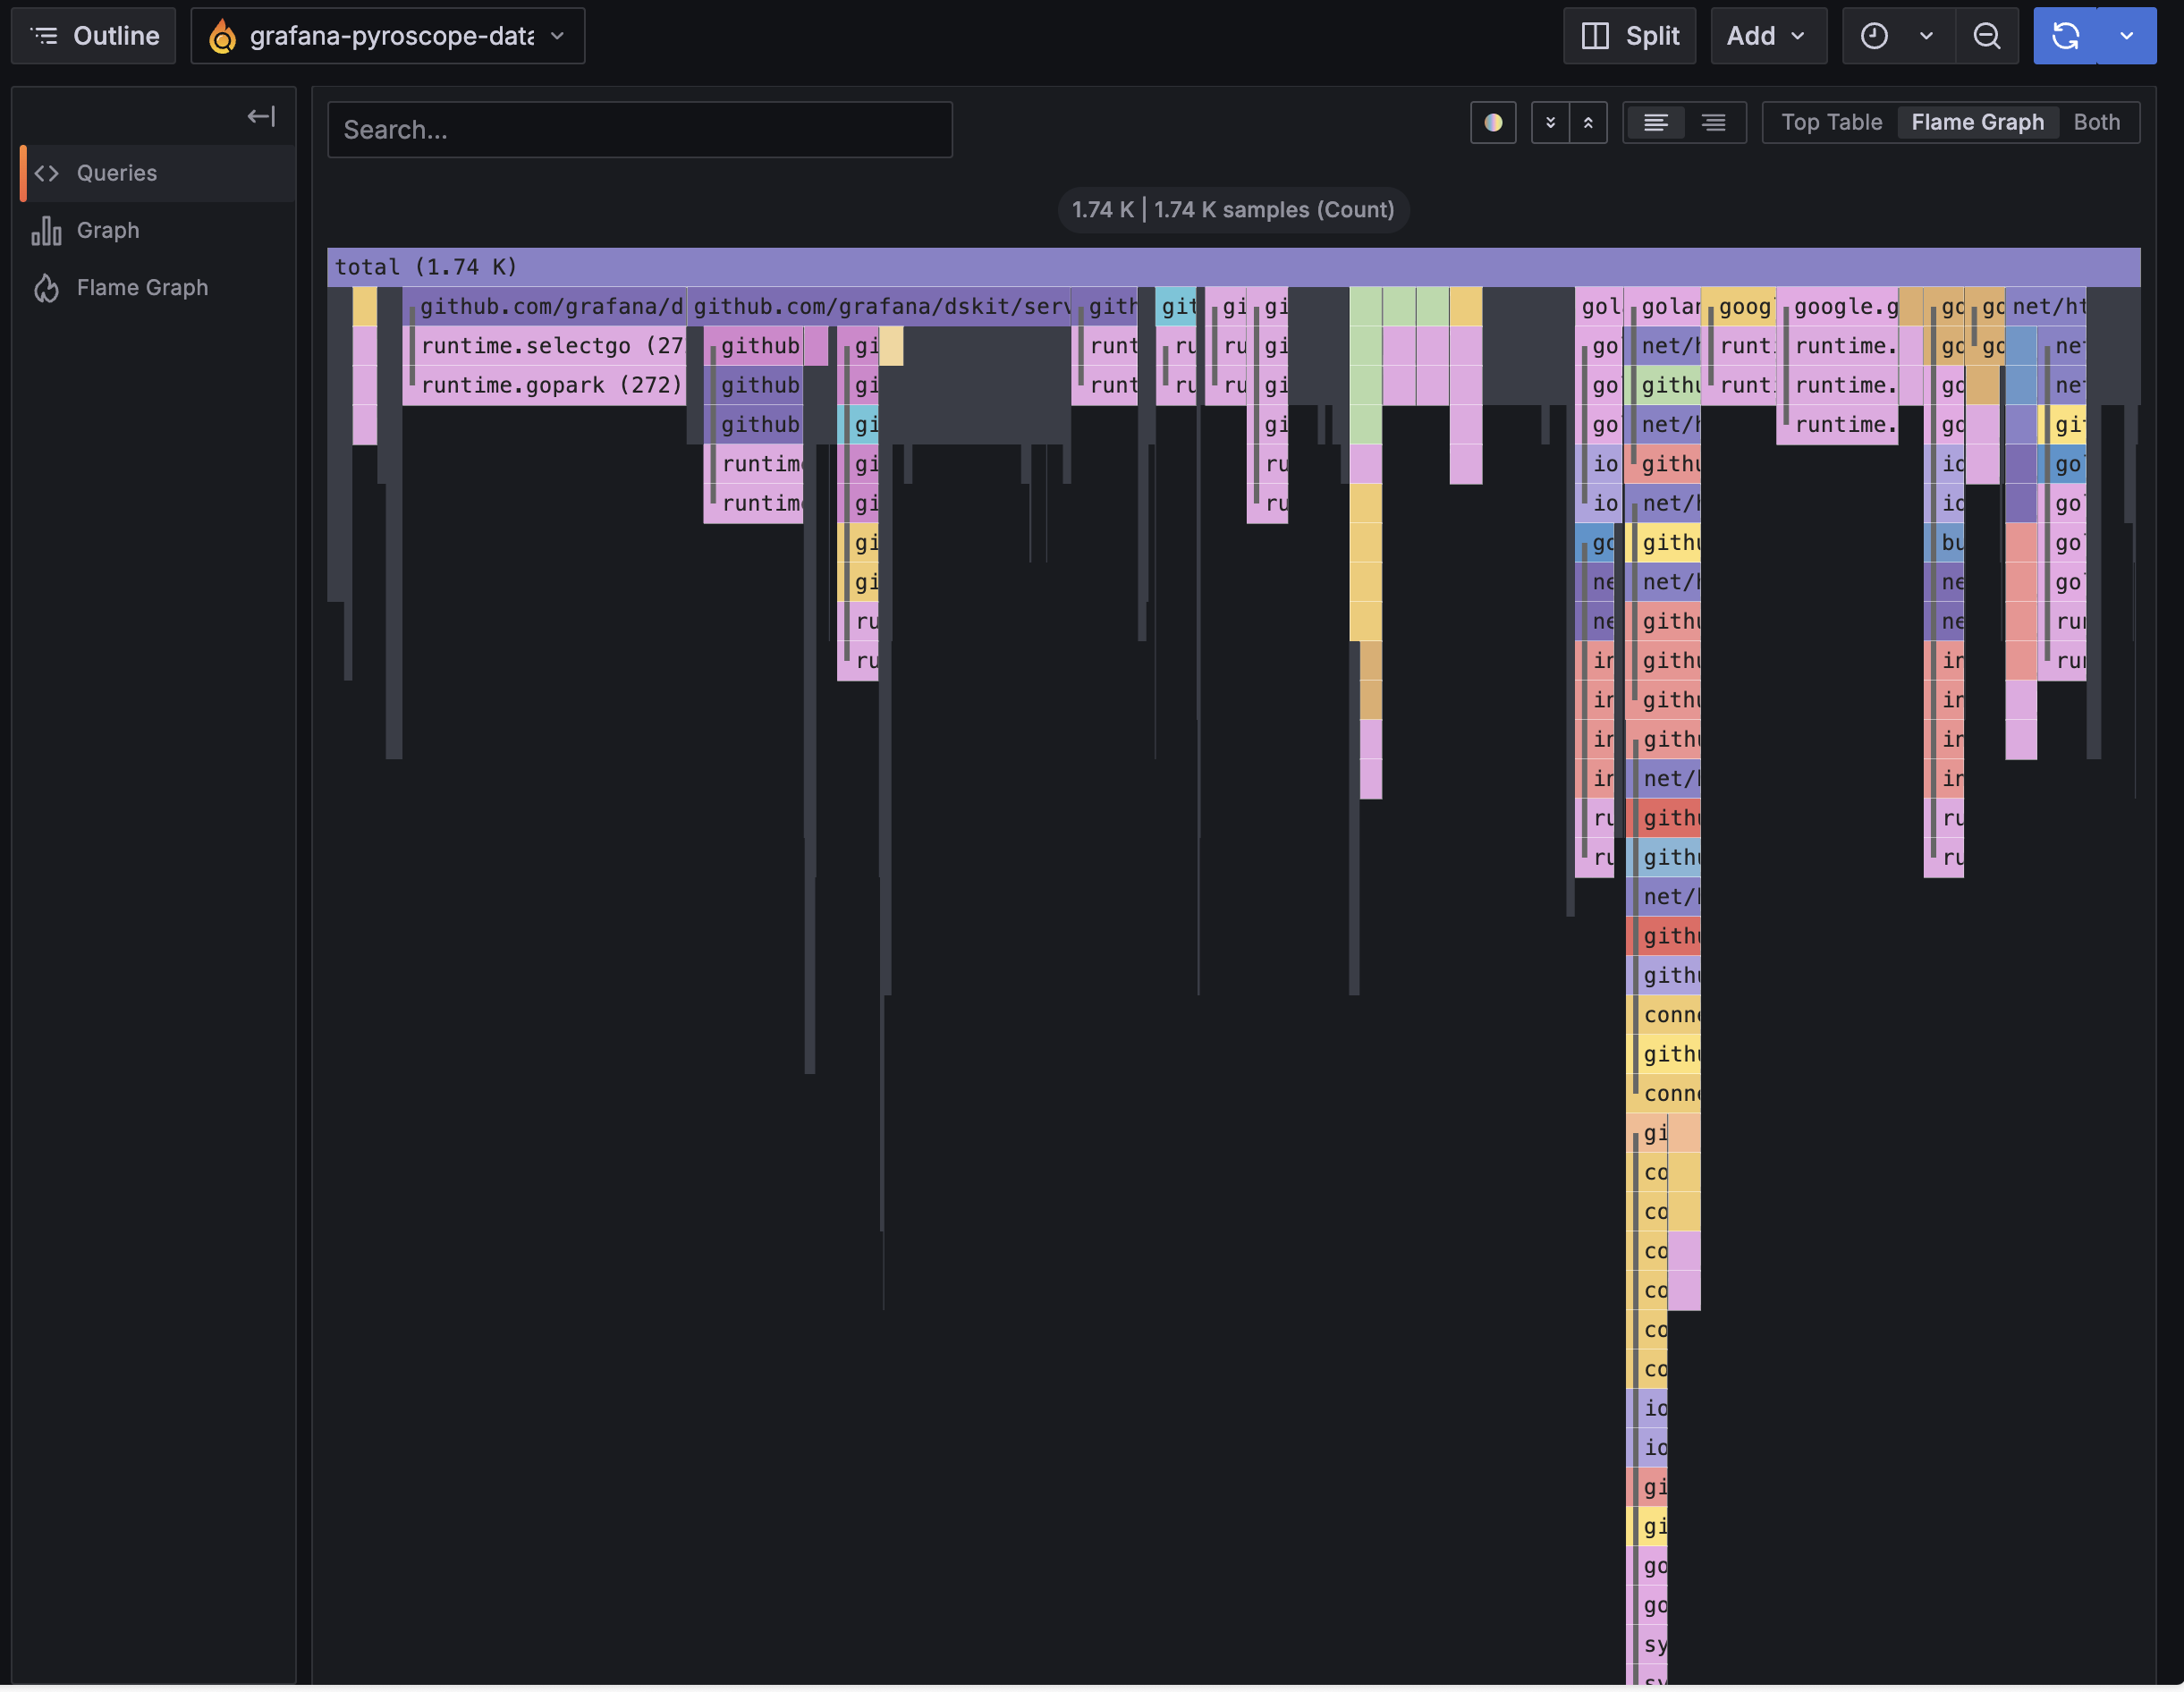
The layout is the same as go tool pprof’s flame graph view, with one key difference: Pyroscope stores a continuous history, so you can scrub back to any time window rather than analyzing a single captured snapshot.
Alternatives
This stack is all Grafana-family OSS. Here’s how each component maps to alternatives:
- Metrics (Prometheus): VictoriaMetrics, InfluxDB (OSS); Amazon Managed Service for Prometheus, CloudWatch Metrics (AWS); Datadog, New Relic, Dynatrace (commercial)
- Logs (Loki + Promtail): OpenSearch + Logstash, Fluentd (OSS); CloudWatch Logs + CloudWatch Agent (AWS); Datadog Logs, Splunk, Elastic Cloud (commercial)
- Traces (Tempo + OpenTelemetry): Jaeger, Zipkin (OSS); AWS X-Ray (AWS); Honeycomb, Datadog APM, Lightstep (commercial)
- Profiles (Pyroscope): Parca (OSS); Amazon CodeGuru Profiler (AWS); Datadog Continuous Profiler, Splunk APM AlwaysOn Profiling, Polar Signals (commercial)
- Visualization (Grafana): Kibana (OSS); Amazon Managed Grafana, CloudWatch Dashboards (AWS); Datadog, New Relic (commercial)
OpenTelemetry is a standard, not a backend, so it works with all of the trace options above. AWS X-Ray has its own SDK but also accepts OTLP, so you can keep the same instrumentation and swap only the exporter.
Summary
- Metrics: produced by
prometheus/client_golang, scraped by Prometheus, queried with PromQL - Logs: produced by
log/slog, shipped by Promtail, stored in Loki, queried with LogQL - Traces: produced by
go.opentelemetry.io/otel, shipped via OTLP gRPC, stored in Tempo, queried with TraceQL - Profiles: produced by
github.com/grafana/pyroscope-go, pushed to Pyroscope, viewed as flame graphs in Grafana
Each signal serves a different role. Metrics tell you something is wrong. Logs tell you what happened. Traces tell you where time was spent per request. Profiles tell you which functions are hot across all requests. Together in Grafana, you can jump from a metric spike → logs at that timestamp → trace for a specific job → flame graph showing the exact code path that caused it.
Comments