Go ships with a remarkably complete set of diagnostic tools. You don’t need external instrumentation to find out why your program is slow or where it’s allocating memory. The hard part isn’t collecting the data, it’s knowing what to look for. This guide walks through profiling, benchmarking, and tracing with pprof as the main focus.
Profiling Overview
Go provides four main diagnostic approaches:
- Profiling - Measures CPU, memory, and blocking costs
- Tracing - Tracks latency and concurrency across requests
- Debugging - Pauses execution to inspect state and flow
- Runtime statistics - Provides a high-level overview of app health
The first two are where you’ll spend most of your time. Debugging and runtime stats are useful in other contexts but outside the scope of this post.
Collecting Profile Data
Profiling Tests
Use go test with profiling flags:
-
CPU profile. Records which functions are active during CPU cycles.
go test -cpuprofile=cpu.out -
Memory (Heap) profile. This tracks the stack trace every time a heap allocation is made.
go test -memprofile=mem.out -
Blocking profile. To track goroutines blocked by locks, channels, or system calls.
go test -blockprofile=block.out
Important. Avoid enabling more than one type of profile simultaneously, as the profiling mechanism itself can distort the result.
Benchmarking
A reliable benchmark isolates the code under test from setup overhead:
func BenchmarkProcessData(b *testing.B) {
    data := loadTestData()
    b.ResetTimer()
    for i := range b.N {
        processData(data)
    }
}-
Always set up test data outside the timed loop
-
Reset the timer after setup to avoid measuring preparation time
-
Use
-benchmemto collect memory allocation metrics:
go test -bench=. -benchmemOutput includes:
-
ns/op - Time per operation
-
B/op - Bytes allocated per operation
-
allocs/op - Number of heap allocations
Compare before and after optimizations to verify improvements.
Profiling Live Applications (using pprof)
For web servers or long-running programs, you need to import "net/http/pprof". This enables profiling at runtime which is especially useful for web applications. It installs diagnostic handlers under the /debug/pprof endpoint.
import _ "net/http/pprof"
import "net/http"

func main() {
    go http.ListenAndServe(":6060", nil)
    runApplication()
}
Access profiles in a browser or with go tool pprof:
-
Goroutine:
http://localhost:6060/debug/pprof/goroutine.
You can also write your own custom profilers https://go.dev/wiki/CustomPprofProfiles
Analyzing Profiles with pprof
You can analyze both files generated by go test and live applications using go tool pprof:
# Analyze a file
go tool pprof cpu.out

# Analyze a live application (collects for 30 seconds)
go tool pprof http://localhost:6060/debug/pprof/profile?seconds=30
You can also use the following flags:
-
topN- show top N samples by function -
-cumflag - sort by cumulative time -
listFunctionName - shows source code with samples per line. -
disasm- shows disassembly. -
web/gv- writes profile graph for browser/Ghostview.
Example top output:
(pprof) top
Showing nodes accounting for 90% of 2s total
      flat  flat%   sum%        cum   cum%
     0.8s  40%   40%      1.2s   60%  main.processData
     0.4s  20%   60%      0.4s   20%  main.calculate
How to read:
-
flat: Time spent in the function itself
-
cum: Cumulative time spent in the function and all functions it calls
Focus on functions with high cumulative time to target optimizations.
Interpreting Heap Profiles
A heap profile shows which parts of the program allocate the most memory. Memory profiling records the stack trace whenever a heap allocation happens. The profiling library samples calls to the internal memory allocation routines, usually recording about one event per 512KB of allocated memory (this can be adjusted).
It doesn’t track stack allocations because they are considered free. The Go compiler uses an algorithm called “escape analysis” to decide if a value should be created on the stack or the heap. Only constructions on the heap are classified as allocations. This is important because the main goal of optimizing memory usage is to reduce the load on the garbage collector (GC). Reducing allocations shortens the duration of collections and prevents the GC from causing high latency in the running application.
Once a profile log is created (e.g. mem.out), use the go tool pprof to read it.
- If you run
go tool pprofwith the--inuse_objectsflag, the tool will report allocation counts instead of sizes.
$ go tool pprof mem.out
(pprof) top
Example output:
Showing nodes accounting for 90% of 5MB total
      flat  flat%   sum%        cum   cum%
     2MB   40%   40%       2MB   40%  main.loadData
     1MB   20%   60%       1MB   20%  main.buildObjects
How to read:
-
Focus on functions with high memory allocations
-
Frequent allocations in these functions can increase GC pressure
-
Consider reusing objects, pooling, or reducing allocations
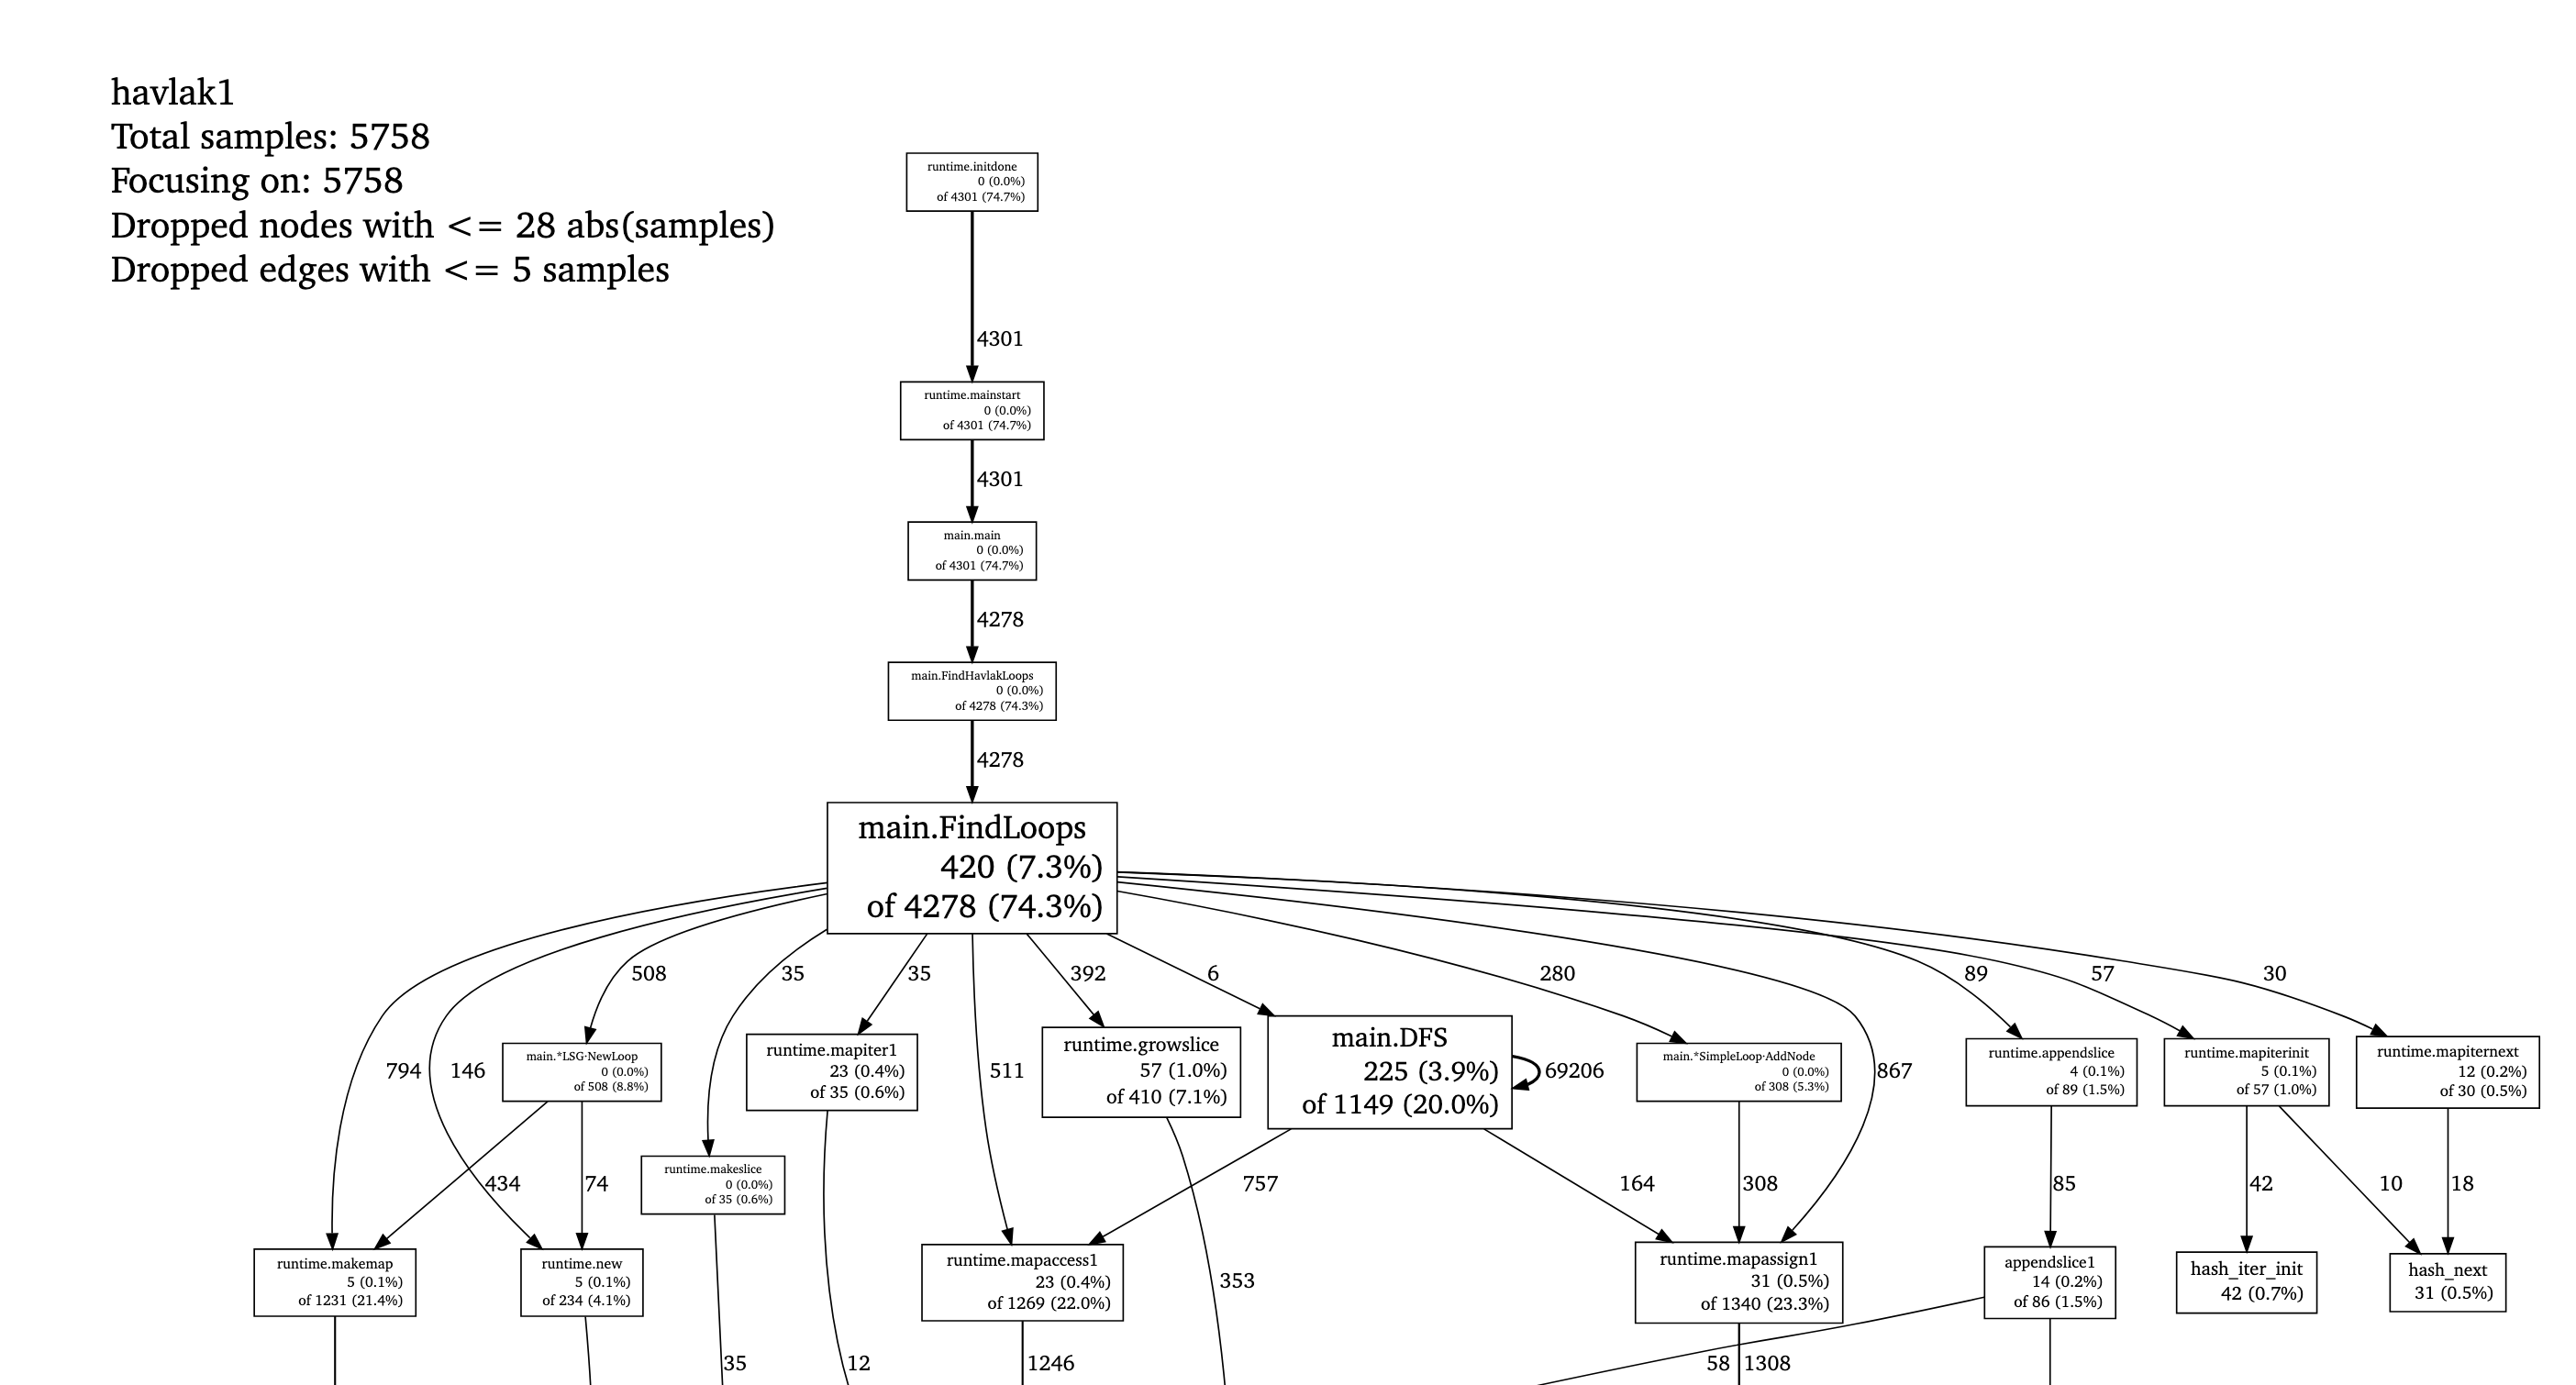
Visualization:
(pprof) webShows a call graph with memory usage per function. Example (top of it) is from here.
- Using the
--inuse_objectsflag output example (from the classic havlak profiling post):
    $ go tool pprof --inuse_objects havlak3 havlak3.mprof
    Adjusting heap profiles for 1-in-524288 sampling rate
    Welcome to pprof!  For help, type 'help'.
    (pprof) list FindLoops
    Total: 1763108 objects
    ROUTINE ====================== main.FindLoops in /home/rsc/g/benchgraffiti/havlak/havlak3.go
    720903 720903 Total objects (flat / cumulative)
    ...
         .      .  277:     for i := 0; i < size; i++ {
    311296 311296  278:             nodes[i] = new(UnionFindNode)
         .      .  279:     }
         .      .  280:
         .      .  281:     // Step a:
         .      .  282:     //   - initialize all nodes as unvisited.
         .      .  283:     //   - depth-first traversal and numbering.
         .      .  284:     //   - unreached BB's are marked as dead.
         .      .  285:     //
         .      .  286:     for i, bb := range cfgraph.Blocks {
         .      .  287:             number[bb.Name] = unvisited
    409600 409600  288:             nonBackPreds[i] = make(map[int]bool)
         .      .  289:     }
    ...
    (pprof)
    ```

## Tracing for Latency and Concurrency

While `pprof` is great for finding where time and memory are spent overall, it doesn't show *when* things happen. Tracing captures the exact execution timeline, including latency across functions and goroutine scheduling:

```bash
go test -trace trace.out
go tool trace trace.out
Unlike pprof, go tool trace opens a rich web-based UI showing a visual timeline of your program’s execution. Traces help identify:
- Functions causing delays or blocking operations
- Goroutines waiting on locks, channels, or network I/O
- Unbalanced or poor utilization of CPU cores
- Latency bottlenecks across concurrent processes
go tool trace gives you visibility within a single process. When latency spans multiple services, tools like Datadog APM and AWS X-Ray fill the equivalent role: they stitch together traces across service boundaries so you can see where time is actually spent in a distributed call chain. If you want profiling to be always-on rather than a manual capture, Pyroscope samples pprof data continuously and stores it - see Adding Full-Stack Observability to a Go Worker Pool for a full setup walkthrough.
Takeaways
-
Profile Before Optimizing: The most critical step is to identify bottlenecks using tools like
go tool pprof. Never guess what is slow, measure it first to focus your efforts on the right areas. -
Prioritize Simple Data Structures: As demonstrated in the classic Go profiling blog post (the
havlakbenchmark), CPU profiles often reveal performance degradation due to inefficient use of complex data types, such as Go’smap. The takeaway is that “There’s no reason to use a map when an array or slice will do” for indexed access or simple sets. Switching from maps to slices can significantly improve runtime. -
Minimize Allocation to Reduce GC Pressure: If the CPU profile shows high time spent in
runtime.mallocgc, your program is memory-bound. The memory profile helps pinpoint code sections responsible for allocating the most memory. The general principle is that the fastest program is often the one that makes the fewest memory allocations. Reducing allocations minimizes garbage collector (GC) work. In Lambda functions, fewer allocations also directly lower peak memory usage, which reduces cost per invocation. -
Implement Memory Reuse for Inner Loops: Even necessary bookkeeping structures can generate significant allocations if created repeatedly in inner loops. Consider object pooling (like
sync.Pool) or reusing buffers to minimize GC pressure. -
Go can match C++ performance in the right conditions: The
havlakoptimization study showed that when Go programmers use profiling tools to carefully manage allocations in inner loops and choose the right data structures, the resulting Go program can be competitive with equivalent, highly-optimized C++ code. That result depends on disciplined profiling-driven optimization, not on Go being fast by default.
Further Reading
- Go Diagnostics: Profiling - the official overview of all diagnostic tools and when to use each
- Profiling Go Programs - the Go blog’s deep dive into the havlak benchmark, including the full optimization journey from maps to slices
Comments